By Michelle Werts
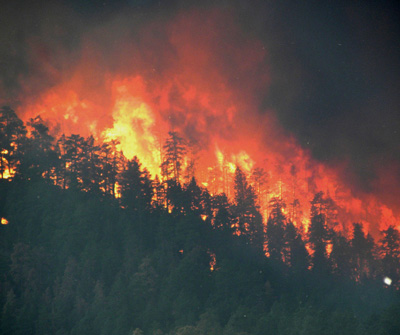
Earlier this month at the annual meeting of the American Geophysical Union, scientists presented new projections about wildfire activity over the next few decades — and it doesn’t look pretty.

Using NASA satellite data and climate models, scientists estimate that in the next 30-50 years, we will see longer, stronger fire seasons across all regions in the U.S. Why? Because NASA’s climate projection models anticipate drier conditions as the climate changes, and drier conditions mean our grasslands and forests are riper for fire activity.
These more intense, longer fire seasons will most likely result in more carbon dioxide emissions, creating a climate change feedback loop. Scientists report that carbon dioxide emissions from wildfires in the West have more than doubled from what they were in the 1980s.
But what exactly does a “more intense” fire season mean? It means fewer fires, but more acres burned. For instance, the National Interagency Fire Center (NIFC) reported that through November 30, 2012, more than 9.1 million acres had burned across the U.S. this year, which is the third highest in their records, which go back to 1960. However, the 55,505 total number of fires this year was on the low end, according to NIFC records. Add the fact that this year’s average fire size was the highest on record, and more intense indeed.
Wildfires are a never-ending concern when it comes to forest and human health and safety. While fire is a necessary part of some forest ecosystems, intense fires can be devastating. That’s why the American Forests policy team works hard to advocate for programs and funding that support not only wildfire fighting itself, but also programs that can help diminish wildfire risk. You can add your voice to the mix by visiting our Action Center and sending a pre-written letter supporting emergency supplements to fight fires or other letters requesting funding for programs that reduce the risk of wildfire.
