How LiDAR maps forests’ role in slowing climate change
By Gabriel Popkin

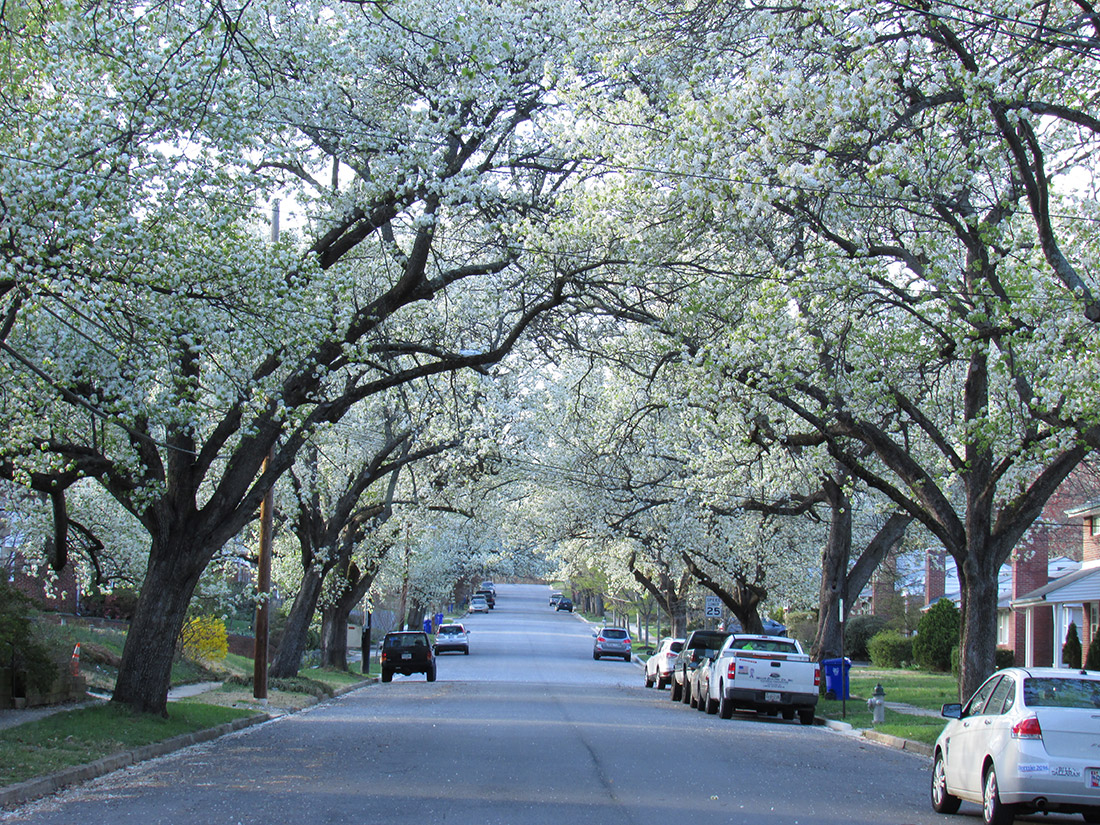
MOSTLY SECOND-GROWTH FORESTS don’t receive the attention of the California redwoods’ soaring heights, the Olympic rainforest’s lush grandeur or the Great Smokies’ exceptional biodiversity. But in an important way, the forests of the mid-Atlantic state just south of the Mason-Dixon line best their more famous counterparts — and all others out there.
“We know more about Maryland forests — at the state scale — than any place in the world,” says George Hurtt, a geographer at the University of Maryland in College Park.
Going back centuries, governments and private companies have sought to quantify forests. The classic field forester slings a measuring tape around a trunk to quantify tree volumes. Stock estimates generated in this manner were of obvious interest to an industry that makes its money by selling wood by the board-foot and to policymakers hoping to maximize the industry’s profitability.
As scientists and others have become aware of the multiple values of trees and forests, however, it’s no longer just loggers who need good forest numbers. Growing trees pull vast amounts of carbon dioxide out of the air and use it as food. Because wood, once dried, is about half carbon by mass, forests can play a key role in reducing greenhouse gas levels and slowing climate change. But for anyone to have confidence in such a climate solution, scientists need an accurate, precise and transparent measurement system for forest carbon.
That’s where Hurtt and his colleagues come in. They have used Maryland’s forests as a proving ground for airborne technologies that could revolutionize how forest carbon is measured worldwide. This year, the state of Maryland may formally adopt Hurtt’s methods to support its greenhouse gas reduction program. Other states are watching closely.
With a federal administration showing little interest in climate change, Hurtt hopes to enable other actors — from states to nonprofits to companies to other countries — to generate robust, reliable forest carbon numbers. Such a system is not enough to win the fight against climate change. But without it, a major piece of that battle likely can’t be won.
A GOLD STANDARD

Efforts to systematically measure and quantify forests date to the 1700s, a time when European countries were struggling with wood shortages. The concept got a major boost in 1928, when the U.S. Congress directed the nascent U.S. Forest Service (USFS) to produce comprehensive estimates of the country’s standing timber. To implement what evolved into the Forest Inventory and Analysis (FIA) program, field crews fanned out to wood-production forests in the 48 states, staked out plots and measured the trees within each. Combined with studies of wood density and width-height relationships that are specific to individual species, the data enabled scientists to generate estimates of the volume of standing trees in forests spread across the country.
Over time, the USFS standardized and improved the methodology and expanded it to all forest land in the continental U.S. The program now includes four plots within one randomly selected 1-acre area for roughly every 6,000 acres of forest, adding up to hundreds of thousands of plots. In addition to standing timber, the inventory includes information on dead wood, soil and other forest attributes. Countries that could afford to do so, such as Mexico, have emulated the FIA program, says Grant Domke, a scientist based in Saint Paul, Minn., who leads the USFS’s carbon research.
“It really is seen as the gold standard of international inventories,” Domke says.
Two developments in the second half of the 20th century began to make even the U.S.’s world-class inventory look a bit slow and creaky for modern needs. One was the recognition of global warming as a major problem facing humanity. Though climate change is primarily caused by burning of fossil fuels, burning and dying forests also make a sizable contribution: about 10 percent of the global total. Forests, however, also sop huge amounts of carbon dioxide out of the atmosphere — almost 25 percent of global emissions, according to scientists’ best estimates.
Those estimates, however, are hamstrung by massive uncertainties. When the United Nations’ Framework Convention on Climate Change went into force in 1994, USFS researchers realized they needed better estimates of how much carbon American forests were storing and releasing.
Christopher Woodall, a USFS researcher who managed the FIA’s carbon program until 2016, Domke and other researchers worked to generate carbon figures from annual forest inventories. They used what is known as the “stock difference” method, by which they compared estimates from inventories taken at different times, rather than use computer modeling to estimate how forest carbon will evolve from one point in time. Just before the 2015 conference that produced the Paris Agreement, the team reported that U.S. forests offset some 15 percent of the country’s carbon emissions. Though still an estimate that needs refining, the USFS’s result gave the U.S. negotiating team enough certainty to include forests in its climate change mitigation plan, Woodall says.
VIEW FROM ABOVE
Periodic inventories may be too slow and not transparent enough to keep an eye on whether countries are meeting their forest carbon targets, however. That’s where a second development — remote sensing — comes in.
A vast forest can be surveyed from the air in the time it takes a ground crew to stake out a few plots. And unlike with forest inventories, which are controlled by individual governments or companies, anybody can, in principle, monitor a forest from the sky.
Despite these advantages, going airborne is hardly a quick and easy fix to the forest measurement problem. Remote sensing measures properties of light, not trees. Information about trees must be derived — a process that inevitably introduces uncertainty. Photography can provide information on forest extent, but says little about tree size, which is crucial for carbon estimates. In the 1960s, forest scientists gained a new and powerful tool: lasers. Laser light bouncing o trees from a plane or satellite returns a bit faster than light bouncing off the ground, potentially yielding data on forest height and structure. With a nod to the related radio-wave technology used to measure speeds of cars on the highway, the laser-based version was called LiDAR.
In 2010, Congress directed the National Aeronautics and Space Administration (NASA) to launch a Carbon Monitoring System to, among other things, develop capabilities for conducting remotely sensed forest inventories. Hurtt, who became the program’s science team leader, assembled a team with colleagues at the University of Maryland, the nearby NASA Goddard Space Flight Center in Greenbelt, Md, and elsewhere.
Given his location, it was natural to use Maryland’s forests — mostly mixed-deciduous, with some pine-dominated areas in the south — as a test bed. The decision was timely for another reason: Legislation passed in 2009 called for a 25 percent cut in the state’s greenhouse gas emissions by 2020, with planting and management of forests providing around 10 percent of the reductions. Suddenly the need for an accurate accounting of forest carbon was not just a scientific curiosity; it was a political necessity.
Hurtt’s team gathered LiDAR data collected by individual counties and by the U.S. Geological Survey, and high-resolution imagery from the U.S. Department of Agriculture. They measured individual trees in those forests using similar methods to the FIA; they also used existing FIA plot data. This allowed them to correlate LiDAR measurements from specific forest types with direct measurements of trees. Hurtt’s team then pieced together what he calls a “wall-to-wall” map of forest carbon, first for two Maryland counties, then for every square meter in the state.
“Our model has millions of points; that’s unheard of in forestry,” Hurtt says. “Usually in forestry you have tens of points.”
Hurtt says his Maryland carbon estimates match USFS numbers in forests. But his method measures 15 to 20 percent more trees throughout the state, he says, because it includes suburbs, cities and other sparsely treed areas, which the service is only beginning to incorporate into their inventory. The service’s “Urban FIA” program has, since 2014, placed measurement plots in around 100 cities across the country.
“We’re seeing trees that the Forest Service doesn’t see,” he says.
Hurtt then ran his data through a computer model to peer into the future. Maryland’s 2.5 million acres of forests range from young ones recolonizing abandoned farmland to a few patches of remnant old-growth, and each forest type packs on carbon at a different rate. An additional 3.7 million acres may contain trees but are not classified as forest. At a recent conference, Hurtt simulated what would happen if Maryland’s forests were allowed to grow unfettered for three centuries. Above-ground stored carbon roughly¦doubled in 75 years and tripled in 300 years.
While forests are never again going to carpet 95 percent of Maryland, Hurtt’s model could help determine where the state will get the most carbon bang for its buck when planning conservation, reforesting or afforesting, says Rachel Marks, an ecologist at Maryland’s Department of Natural Resources in Annapolis, who works on incorporating the new methods into the state’s climate plan. The model the state currently uses makes a lot of unrealistic assumptions, Marks says, such as that forests add carbon at a constant rate independent of age.
For Hurtt, the next prize is the Regional Greenhouse Gas Initiative — a pact between Maryland, Delaware, New York and the six New England states to jointly reduce emissions. Because of the uncertain measurement science, the initiative currently limits how much of states’ claimed emissions reductions can come from forests. If Maryland shows it can generate solid numbers, he hopes to get that limit raised for the other eight states.
AN UNCERTAIN FUTURE
Not everyone is convinced that remote sensing is a panacea for forest measurement. Even today’s sophisticated methods have difficulty detecting small but important changes in tree growth, some researchers point out.
The USFS, for its part, has for years studied how to incorporate remote sensing into its inventories, and the agency is a partner in Hurtt’s project. But the team remains committed, for now, to the timeintensive but time-tested tape measures.
“That’s the way FIA works and the way our team works,” Domke says. “We’re talking about monitoring 300 million hectares that we’re responsible for. We want to make sure we’re doing things in a measured sort of way.”
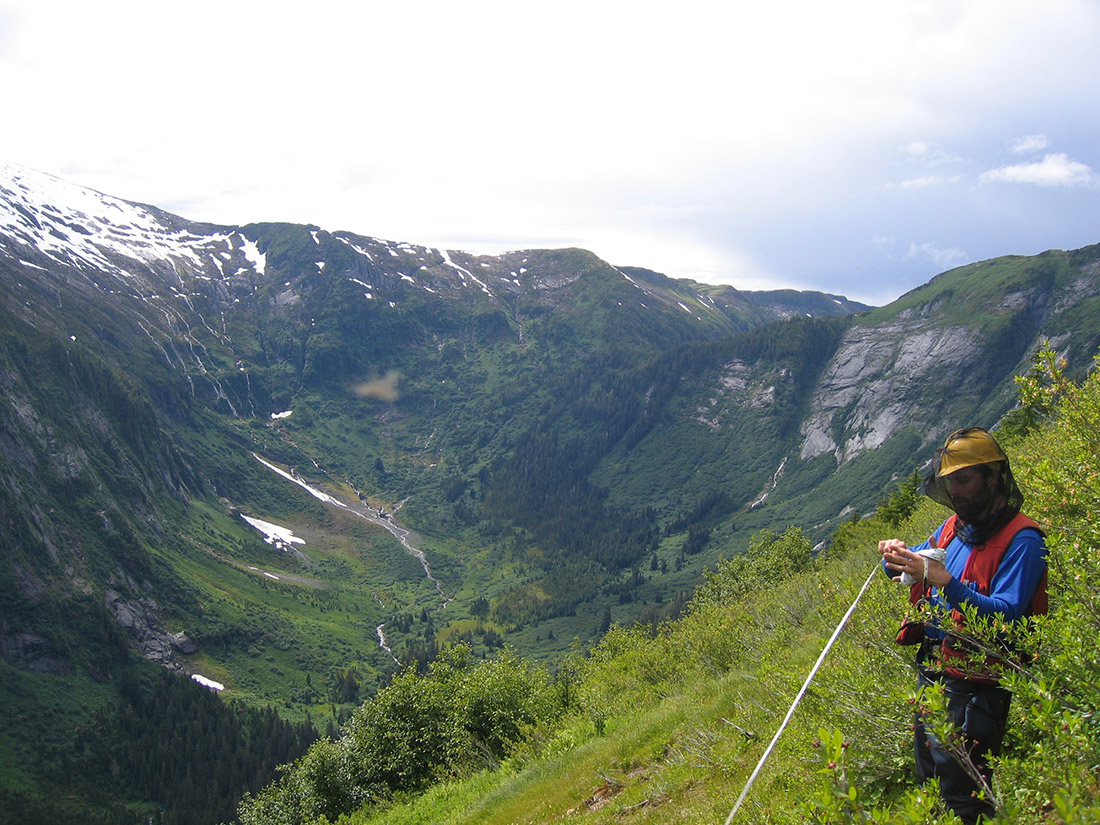
Domke and Woodall are, however, especially excited about LiDAR’s potential in Alaska. The mammoth state, which accounts for more than one-sixth of the country’s total area, contains millions of acres of spruce-aspen forest in its vast and mostly roadless interior. Some estimate the area could hold as much as a third of the country’s total forest carbon, but those estimates are wildly uncertain, because the state is so poorly surveyed (including by FIA) — and because much of the carbon resides underground, in the soil, which Woodall calls the “final frontier” of forest carbon measurement.
Putting crews on the ground requires expensive and treacherous trips by helicopter or bush plane; grizzly bears and other dangerous animals roam, and then there’s the infamous “state bird” — mosquitoes large and numerous enough to threaten a field worker’s sanity. While USFS is slowly installing FIA plots, a way to gather data from the sky would be very helpful for measuring the above-ground carbon, Woodall says. A NASA grant has allowed the service to start mapping the state using methods similar to what Hurtt has pioneered in Maryland.
The effort’s ultimate success will depend on a lot of things — including politics. A news report in May revealed a plan to end the carbon monitoring program. Congress members have since written into spending bills language to continue funding the program, and the recently confirmed NASA administrator James Bridenstine has also expressed support for it, but the future remains uncertain.
Ending the program would be especially poor timing because NASA is about to put the first dedicated forest-measuring laser into space. This fall, the Global Ecosystems Dynamics Investigation will take up a perch on the International Space Station, which flies above most of the planet’s surface. The instrument will sample forest carbon over the entire tropics and most of the temperate zone. For scientists such as Hurtt, a globally consistent forest measurement tool will be a dream come true. But, how much impact it has on the world’s forests and the carbon stored within will depend entirely on what happens on the ground.
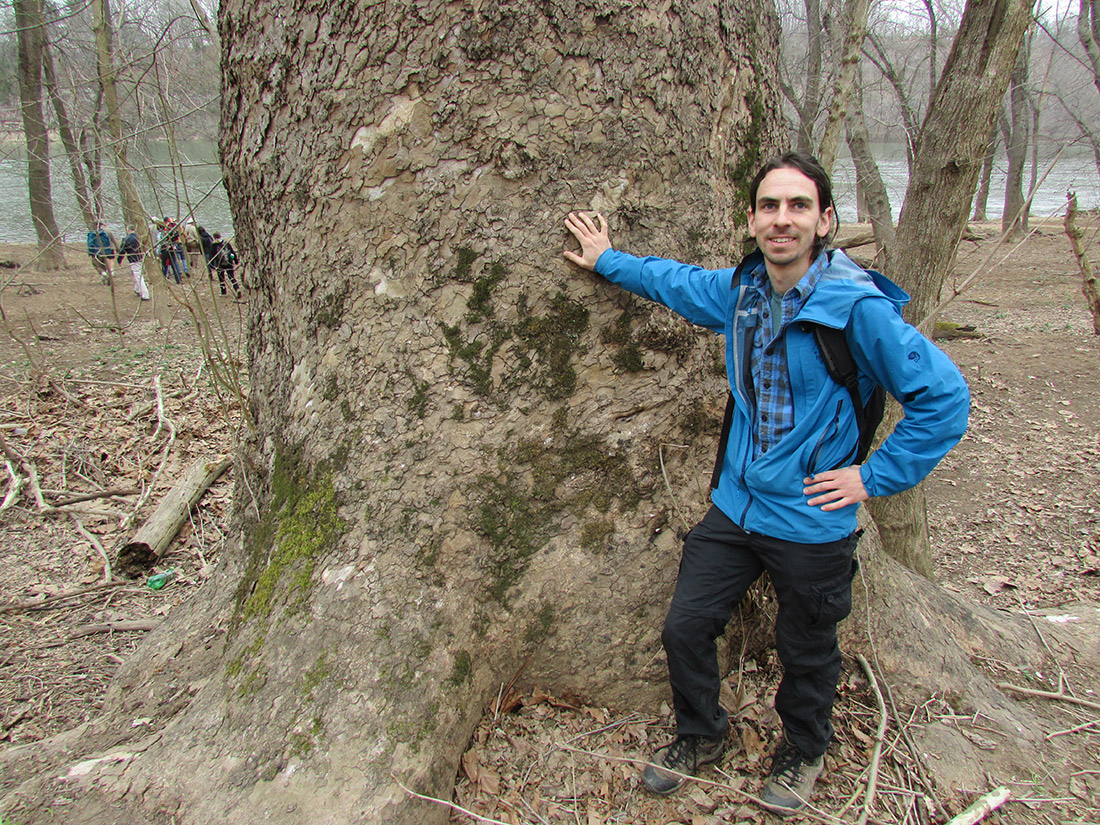
Gabriel Popkin is a science and environmental writer who has written for The New York Times, The Washington Post, and more than 30 other publications. In his spare time, he serves on Mount Rainier, Maryland’s tree commission and leads tree walks in and around Washington, D.C.